
Once you have collected, interpreted and evaluated your ILD data, go back to the software's main screen, and collect ITD data by clicking on the "ITD" button
 .
.
The software will once again play sounds of high or low frequencies and ask you to indicate whether you heard them as on the left or right by muse clicks or keyboard arrow keys. Run through the trials using the same procedure as when you collected the ILD data. Note: most people find it very difficult to hear ITDs for high frequencies as lateralized to the left or right. So you will probably hear most or all of the high pitched sounds very close to the middle, and find it difficult to judge whether they are on the left or right. Don't worry if you find this difficult, that is quite normal. Just listen carefully, give your best guess.
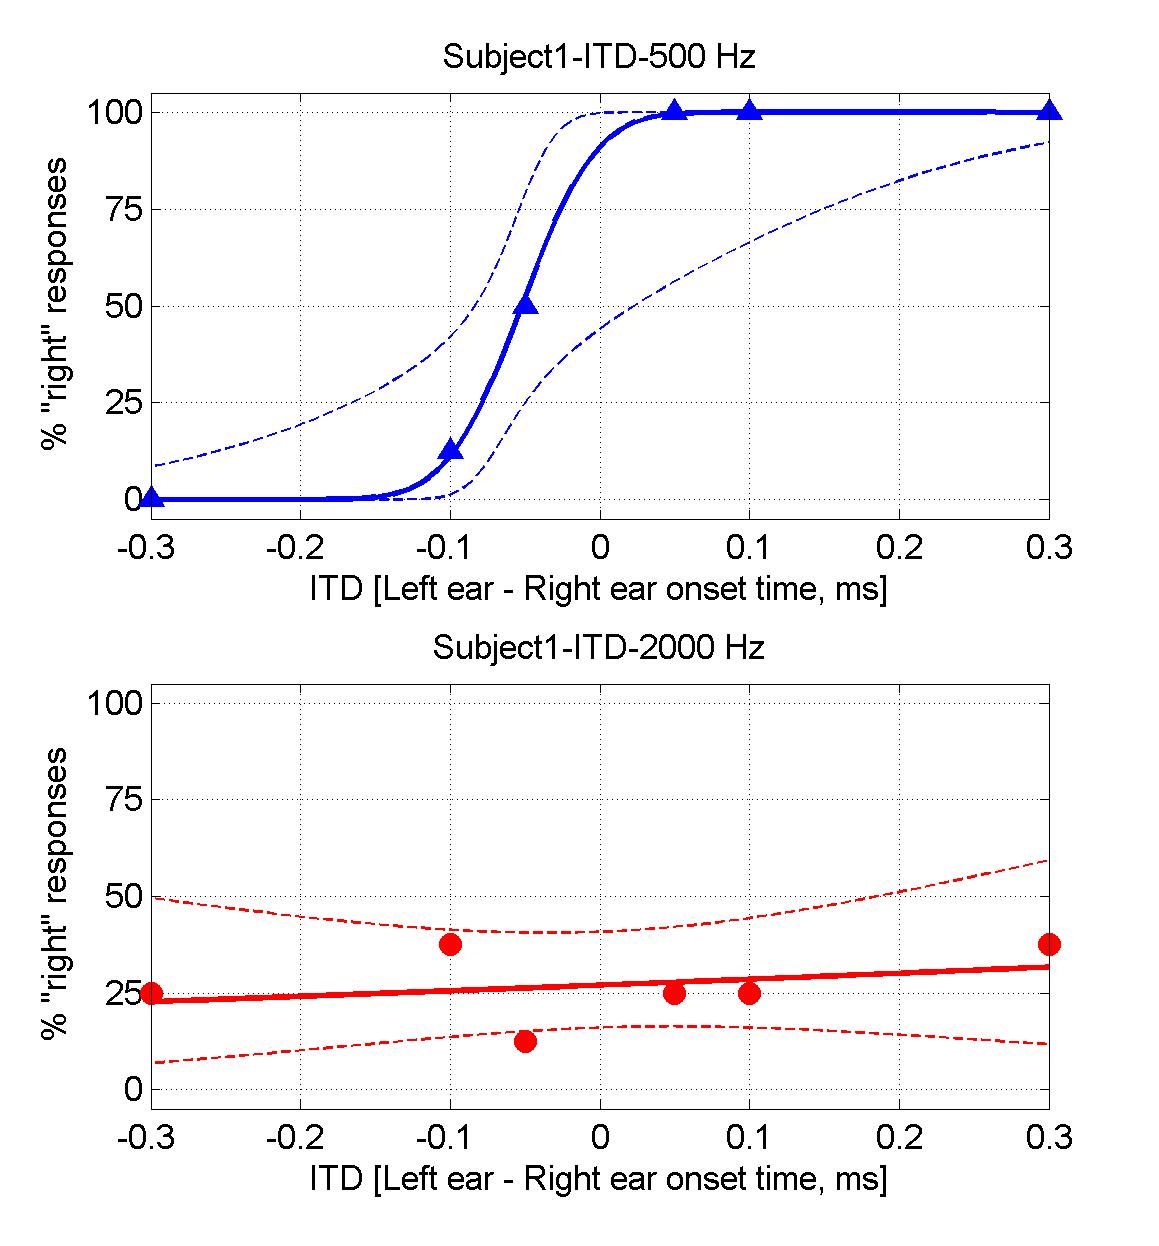
When you have completed your block of trials, the software will plot your results, and you may get a figure looking similar to this:
If you are doing these exercises as part of a taught class, you should again consider making a print-out of these result graphs so that you can show them to your instructors if necessary.
Using the same considerations you used when you interpreted the ILD data, answer the following questions:
Question: What is your "ITD threshold" for each of the frequencies tested?
Question: Would you consider your ITD thresholds for the two frequencies similar, or substantially different?