
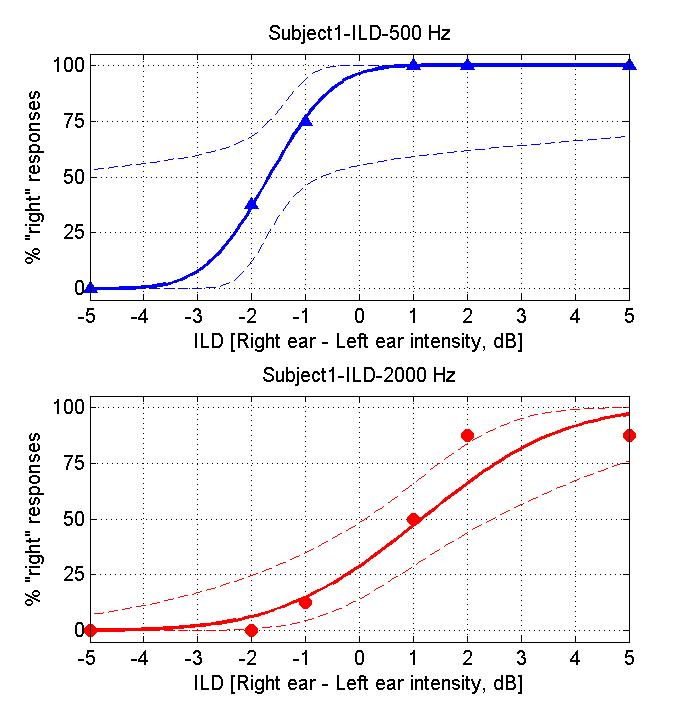
When you have completed your trials the program will generate a plot of your results for you, which should look more or less like this:
If you are doing these exercises as part of a taught class, you should consider making a print-out of these result graphs so that you can show them to your instructors if necessary. (There should be a File | Print menu on the top left above the figure).
The triangular or circular symbols show how often you clicked "right" for the ILD value given on the x-axis. The continuous line is a "cumulative Gaussian" sigmoidal curve fitted to your data by the software. Fitting curves like this is a good way of estimating the "underlying psychometric function" (i.e. the function that describes your sensitivity to changes in a particular sensory parameter) from the data sample we obtained.
Question: On the psychometric functions you obtained, which ILD values are associated with 50% right responses? Which ILD value would you expect to be associated with 50% right?
Psychometric curves are useful for determining how sensitive you are to ILDs. The steeper the slope of the sigmoid, the smaller the change in ILD required to produce a "noticeable" difference in your % right judgments. However, people rarely report sensory performance as slope values (%right/ dB). Instead, they tend to report "thresholds", i.e. changes in ILD which are just large enough to raise the %Right judgments from 50% (completely random guessing) to some "threshold performance level".
Exercise: Choose a threshold level (75% correct might be a good choise) and determine the corresponding ILD threshold for the two frequencies tested. Make a note of these ILD thresholds.
The thresholds obtained for the two frequencies may be very similar, or somewhat different. Do you have a feeling for whether they are "meaningfully different"? There are really two aspects to this question: 1) is the difference "substantial" (physiologically significant, and 2) do you think it might be statistically significant? For the first part you will need to use your judgment - there is no generally accepted way of deciding how big is big. But if the difference is not statistically significant, then any observed difference in thresholds for the two frequencies may not be real.
However, to answer the second part of this question rigorously would require a suitable statistical test, for example some type of "bootstrap". The statistical techniques needed to do this properly are somewhat beyond the scope of this practical. However, you may be able to gain some intuition about this if you think about the problem in the following manner: Your "true" psychometric function will specify: for each particular ILD, the probability that you will report the sound as coming from the right. The experiment cannot measure this probability directly, only estimate it from the frequency of actual right responses in a quite limited number of trials (here about 8 for each ILD tested). Let's say the true underlying probability for a particular ILD was 75%. Testing that ILD would then be a bit like flipping a biassed coin that has a probability of landing "heads" on 75% of trials. Would it be impossible for such a biased coin to produce, say, only 50% heads in a short run of only 8 trials? If you think this through you will probably appreciate that the % right scores observed in this very short experiment are only very rough estimates of your true psychometric function. You may also have wodered what the think broken curves on teh plots represent. These are 95% confidence intervals for the psychometric functions fitted to your data. The algorithm that fitted the sigmoids is clever enough to appreciate that the sigmoid it produced is only an estimate, and that the true underrlying function could be fairly different from that "best estimate". So when you compare the data obtained at the two different frequencies, you could ask yourself, would it be unreasonable to suspect that the data points in the top graph come from the confidence interval plotted in the lower graph, or vice-versa?
Question: Would you consider your sensitivity to ILDs essentially similar, or substantively different, for the two frequencies you tested?