
Using the methods described in the previous sections, you should by now have obtained estimates of your own ILD sensitivity at two different test frequencies (500 and 2,000 Hz if you ran with the suggested values). Your ILD thresholds in dB may or may not have been very similar for the two frequencies. However, ILDs are a cue to sound source direction. Source directions are not specified in dB! To localize sounds in space, your brain needs to "translate" ILD values to angles relative to the inter-aural axis. To see how useful a particular ILD would be, say, for detecting a change in sound source direction away from "straight ahead" (zero degrees azimuth) we need to know what ILD values are normally associated with different sound source directions for different sound frequencies. The graph below shows ILDs measured as a function of sound source direction measured in an adult male with small microphones inserted in the ear canal. ILD values are plotted for a number of frequencies and sound source directions (azimuthal angles).
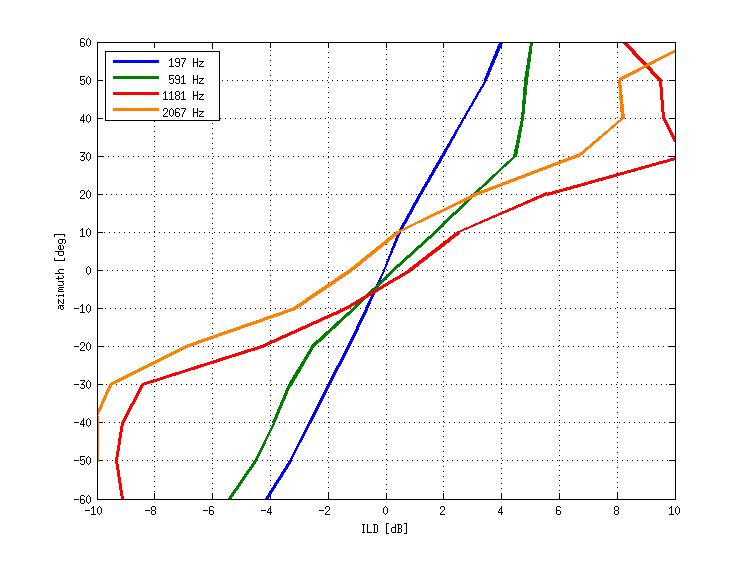
This graph is rather busy, but you will hopefully appreciate that the slope of these graphs near zero is different for different frequencies.
At frequencies close to 500 Hz, the slope is equivalent to approximately 7.35 degrees / dB, while at frequencies near 2000 Hz the slope is closer to 4 degrees / dB. Using these slope values as well as the ILD thresholds you have estimated for those frequencies, calculate your estimated "minimum audible angles (MAAs)", i.e. the changes in source direction that would correspond to the ILD thresholds that you have estimated earlier. Make a note of the MAAs.
Does a smaller MAA mean better or worse spatial hearing?
Did you obtain a smaller MAA at the higher or lower frequency?