ILD / ITD practical
ILD / ITD practical
Here below you can find the Matlab source code for a program authored by Matthieu Lesburgueres and Jan Schnupp which you can use to run a psychoacoustic experiment to measure your own sensitivity to ITDs and ILDs.
-
Click HERE to download a zip archive of the Matlab code source.
-
Unzip the content into a folder of your choice.
-
Start Matlab and change the matlab working directory to the folder where you have copied the content of the zip file.
-
Put on headphones, make sure the volume of your soundcard is not set very loud.
-
To start the experiment, run "Experiment.m"
When you got that far, click on Collecting ILD data below for instructions what to do next.
Collecting ILD data
Collecting ILD data
When you launch Experiment.m you should obtain a window which looks like this:
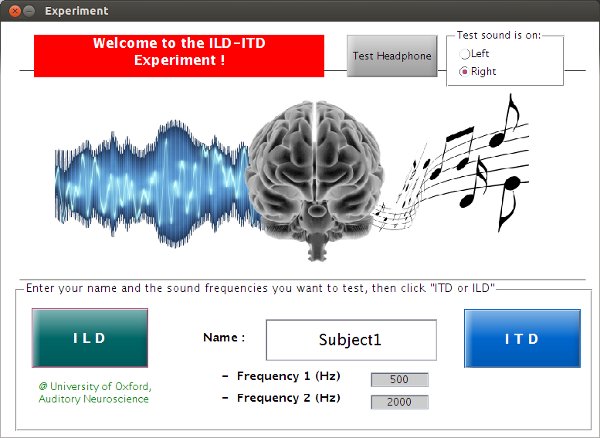
Before you run the experiment, we need to check that the computer knows which sound channel maps to which ear on your headphones. Put your headphones on and click the "Test Headphone" button on the top right of the "Experiment" window. You should hear a short noise burst in one ear only - most likely, but not necessarily the right ear. If the sound was on the left rather than the right, don't worry, just make sure the radiobutton at the top right is set to indicate which side you heard the sound on.
Now you are ready to run the experiment. Enter your name or nickname in the box in the center (this will be used to label data file names and graphs generated as you run the experiment) and choose two sound frequencies at whcih to measure your binaural cue sensitivity. We suggest 500 Hz and 2000 Hz as good frequencies to try.
Question: would you consider 500 Hz and 2000 Hz low frequencies, or high? Bear in mind that the human auditory system operates over a freqency space of ca 50-16000 Hz, but that frequencies are represented in a roughly logarithmic manner, i.e. the 100 Hz frequency span 100-200 Hz is one octave, while the 8000 Hz wide span from 8000-16000 Hz is similarly also only one ocatve.
Once you have entered your values for Name, Frequency 1 and Frequency 2, click ILD to launch the first part of the experiment. Listen carefully because the first sound for you to listen to will start playing very soon after you clicked ILD.
A pop-up window will appear which looks like this:
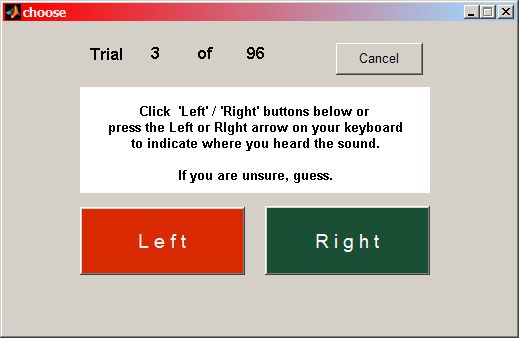
Indicate whether you heard the last sound as coming from the left or the right. Note: many fo the sounds will sound very close to the center, while others will be more clearly on one side or the other. So sometimes you may find it hard to tell. In those cases your answer should be "your best guess". That your best guesses may be wrong some of the time when the tested ILD values get small is part of the experiment.
You can indicate your decision either by clicking on the "Left" or "Right" buttons, or by pressing the Left or Right arrow keys on your computer keyboard. When you have indicated your decision for the last sound presented, the software will automatically present the next sound after a short delay, so keep listening attentively until you have completed all the trials. The software will present high or low sounds of varying ILDs in a random order. Note that, just as it is quite possible for a fair coin to come up "heads" on five or six coin flips in a row, you may also have quite large "runs" of successive sounds on the left or the right.
I personally find it helpful to rest two fingers above the left and right arrow keys on my keyboard, then listen with my eyes closed, and run through the trials in fairly quick succession. If you are doing this for the first time, you may want to do a test run of only about 20 or so trials to become comfortable with the procedure, then stop the experiment by clicking "Cancel" above, and then restart it by clicking "ILD" again on the main window.
Once you are comfortable with the procedure, run through a whole set of trials. The software will automatically generate a plot of your responses in this run. How you should interpret those data is explained in the next section.
Interpreting the ILD data
Interpreting the ILD data
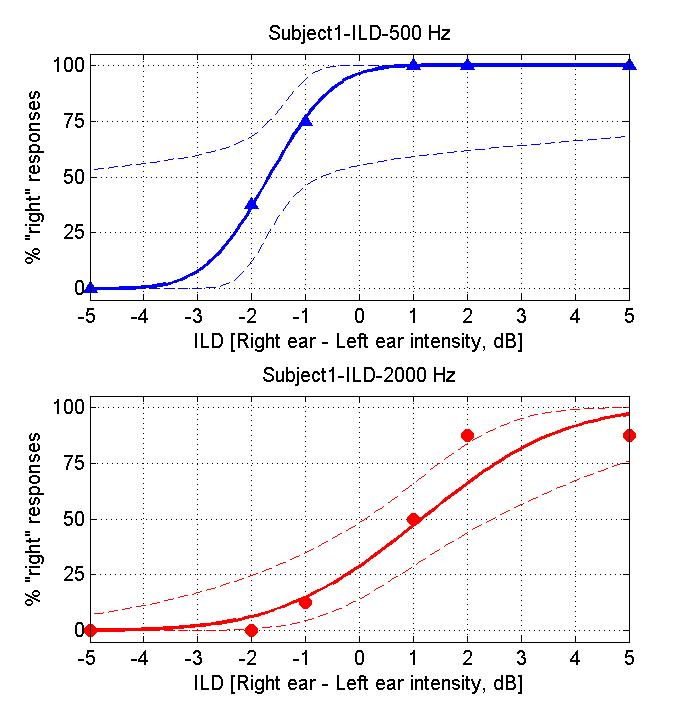
When you have completed your trials the program will generate a plot of your results for you, which should look more or less like this:
If you are doing these exercises as part of a taught class, you should consider making a print-out of these result graphs so that you can show them to your instructors if necessary. (There should be a File | Print menu on the top left above the figure).
The triangular or circular symbols show how often you clicked "right" for the ILD value given on the x-axis. The continuous line is a "cumulative Gaussian" sigmoidal curve fitted to your data by the software. Fitting curves like this is a good way of estimating the "underlying psychometric function" (i.e. the function that describes your sensitivity to changes in a particular sensory parameter) from the data sample we obtained.
Question: On the psychometric functions you obtained, which ILD values are associated with 50% right responses? Which ILD value would you expect to be associated with 50% right?
Psychometric curves are useful for determining how sensitive you are to ILDs. The steeper the slope of the sigmoid, the smaller the change in ILD required to produce a "noticeable" difference in your % right judgments. However, people rarely report sensory performance as slope values (%right/ dB). Instead, they tend to report "thresholds", i.e. changes in ILD which are just large enough to raise the %Right judgments from 50% (completely random guessing) to some "threshold performance level".
Exercise: Choose a threshold level (75% correct might be a good choise) and determine the corresponding ILD threshold for the two frequencies tested. Make a note of these ILD thresholds.
The thresholds obtained for the two frequencies may be very similar, or somewhat different. Do you have a feeling for whether they are "meaningfully different"? There are really two aspects to this question: 1) is the difference "substantial" (physiologically significant, and 2) do you think it might be statistically significant? For the first part you will need to use your judgment - there is no generally accepted way of deciding how big is big. But if the difference is not statistically significant, then any observed difference in thresholds for the two frequencies may not be real.
However, to answer the second part of this question rigorously would require a suitable statistical test, for example some type of "bootstrap". The statistical techniques needed to do this properly are somewhat beyond the scope of this practical. However, you may be able to gain some intuition about this if you think about the problem in the following manner: Your "true" psychometric function will specify: for each particular ILD, the probability that you will report the sound as coming from the right. The experiment cannot measure this probability directly, only estimate it from the frequency of actual right responses in a quite limited number of trials (here about 8 for each ILD tested). Let's say the true underlying probability for a particular ILD was 75%. Testing that ILD would then be a bit like flipping a biassed coin that has a probability of landing "heads" on 75% of trials. Would it be impossible for such a biased coin to produce, say, only 50% heads in a short run of only 8 trials? If you think this through you will probably appreciate that the % right scores observed in this very short experiment are only very rough estimates of your true psychometric function. You may also have wodered what the think broken curves on teh plots represent. These are 95% confidence intervals for the psychometric functions fitted to your data. The algorithm that fitted the sigmoids is clever enough to appreciate that the sigmoid it produced is only an estimate, and that the true underrlying function could be fairly different from that "best estimate". So when you compare the data obtained at the two different frequencies, you could ask yourself, would it be unreasonable to suspect that the data points in the top graph come from the confidence interval plotted in the lower graph, or vice-versa?
Question: Would you consider your sensitivity to ILDs essentially similar, or substantively different, for the two frequencies you tested?
Evaluate the usefulness of ILDs as localization cues
Evaluate the usefulness of ILDs as localization cues
Using the methods described in the previous sections, you should by now have obtained estimates of your own ILD sensitivity at two different test frequencies (500 and 2,000 Hz if you ran with the suggested values). Your ILD thresholds in dB may or may not have been very similar for the two frequencies. However, ILDs are a cue to sound source direction. Source directions are not specified in dB! To localize sounds in space, your brain needs to "translate" ILD values to angles relative to the inter-aural axis. To see how useful a particular ILD would be, say, for detecting a change in sound source direction away from "straight ahead" (zero degrees azimuth) we need to know what ILD values are normally associated with different sound source directions for different sound frequencies. The graph below shows ILDs measured as a function of sound source direction measured in an adult male with small microphones inserted in the ear canal. ILD values are plotted for a number of frequencies and sound source directions (azimuthal angles).
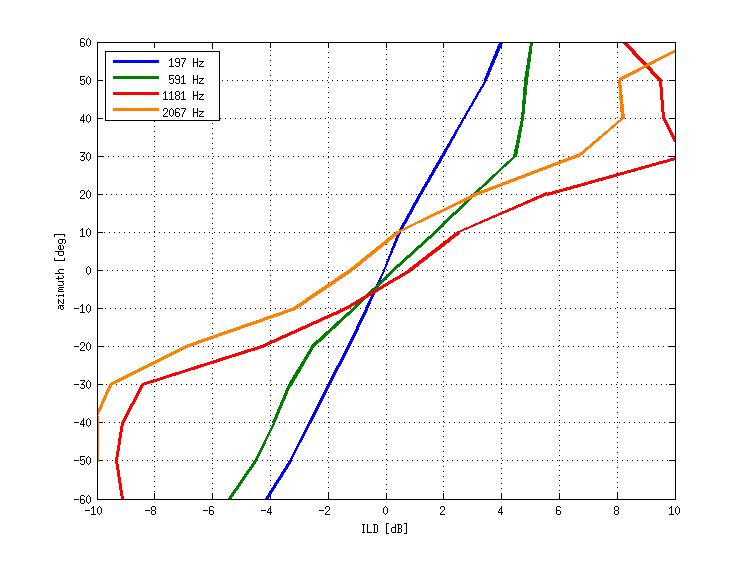
This graph is rather busy, but you will hopefully appreciate that the slope of these graphs near zero is different for different frequencies.
At frequencies close to 500 Hz, the slope is equivalent to approximately 7.35 degrees / dB, while at frequencies near 2000 Hz the slope is closer to 4 degrees / dB. Using these slope values as well as the ILD thresholds you have estimated for those frequencies, calculate your estimated "minimum audible angles (MAAs)", i.e. the changes in source direction that would correspond to the ILD thresholds that you have estimated earlier. Make a note of the MAAs.
Does a smaller MAA mean better or worse spatial hearing?
Did you obtain a smaller MAA at the higher or lower frequency?
Collecting and Interpreting ITD data
Collecting and Interpreting ITD data
Once you have collected, interpreted and evaluated your ILD data, go back to the software's main screen, and collect ITD data by clicking on the "ITD" button
 .
.
The software will once again play sounds of high or low frequencies and ask you to indicate whether you heard them as on the left or right by muse clicks or keyboard arrow keys. Run through the trials using the same procedure as when you collected the ILD data. Note: most people find it very difficult to hear ITDs for high frequencies as lateralized to the left or right. So you will probably hear most or all of the high pitched sounds very close to the middle, and find it difficult to judge whether they are on the left or right. Don't worry if you find this difficult, that is quite normal. Just listen carefully, give your best guess.
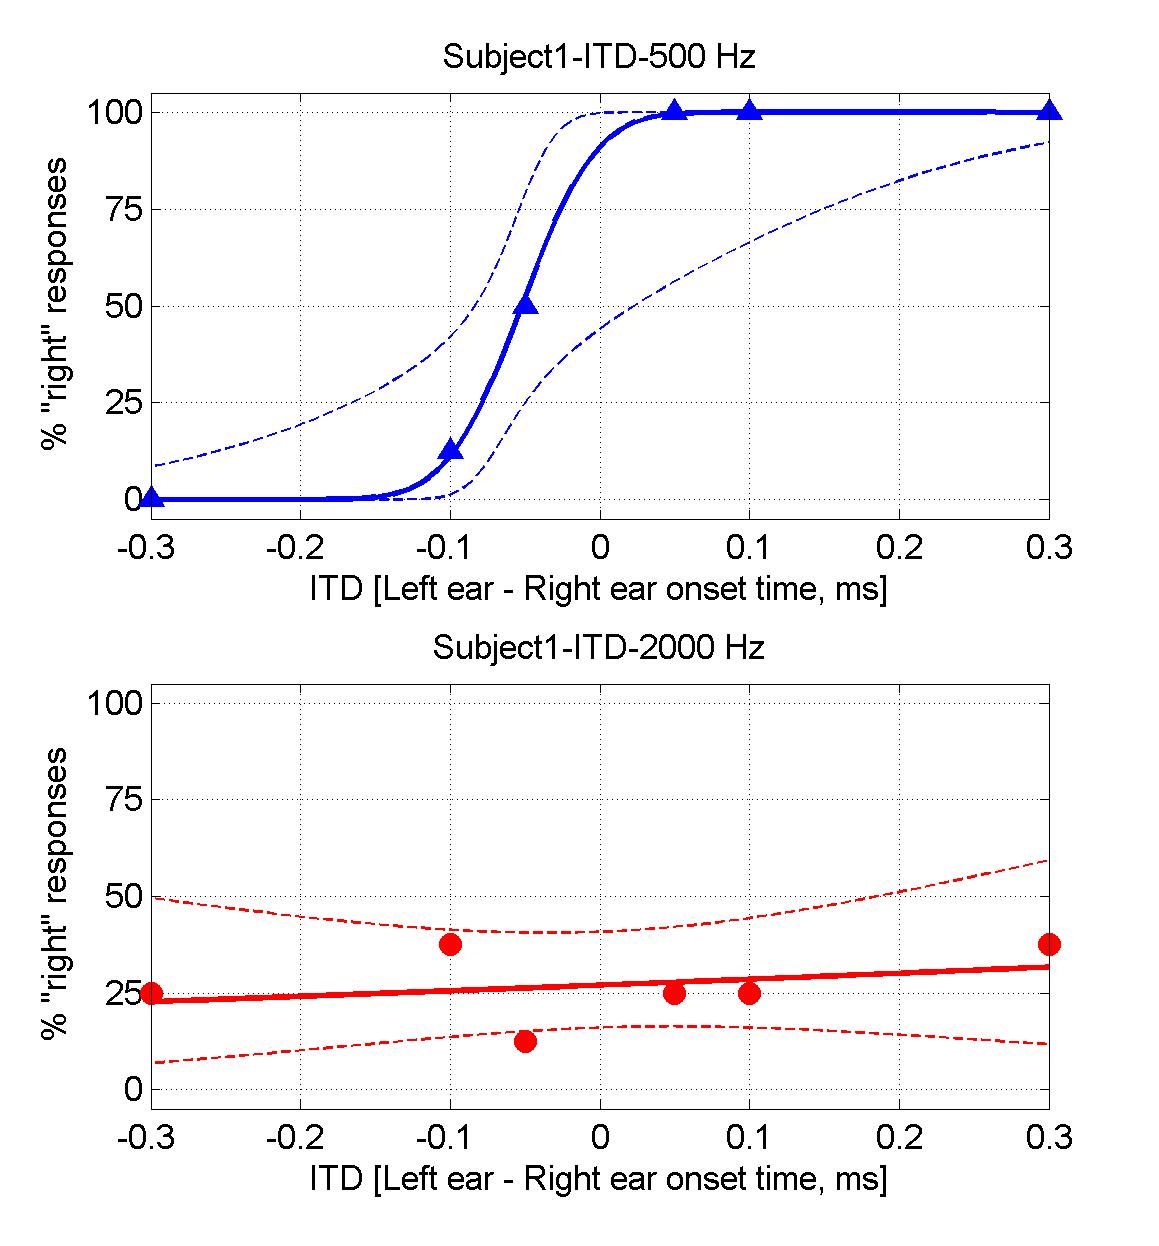
When you have completed your block of trials, the software will plot your results, and you may get a figure looking similar to this:
If you are doing these exercises as part of a taught class, you should again consider making a print-out of these result graphs so that you can show them to your instructors if necessary.
Using the same considerations you used when you interpreted the ILD data, answer the following questions:
Question: What is your "ITD threshold" for each of the frequencies tested?
Question: Would you consider your ITD thresholds for the two frequencies similar, or substantially different?
Evaluate the usefulness of ITDs
Evaluate the usefulness of ITDs
Unlike ILDs, ITDs are generally thought not to vary much with frequency. The graph below shows ITDs as a function of sound source direction measured in an adult male with small microphones inserted in the ear canal.
Question: Use the graph to work out what MAAs the ITD thresholds you have obtained would correspond to. How do these MAAs compare to those you obtained for ILDs?

Was Rayleigh correct?
Was Rayleigh correct?
Lord Rayleigh is credited for developing the "duplex theory" for sound localization, which states that the brain relies heavily on ITDs for low frequency sounds, and on ILDs for high frequency sounds.
Final Question: In your own words, do the results you have obtained in this practical agree with the duplex theory?
This concludes this practical.
(Note that this practical varied ILDs or ITDs independently, one at a time. In nature, they do of course tend to vary together, so that sounds that are louder in the left also tend to arrive earlier at the left. So how does the brian put ITDs and ILDs together? If you are curious you can explore this on the next page.)