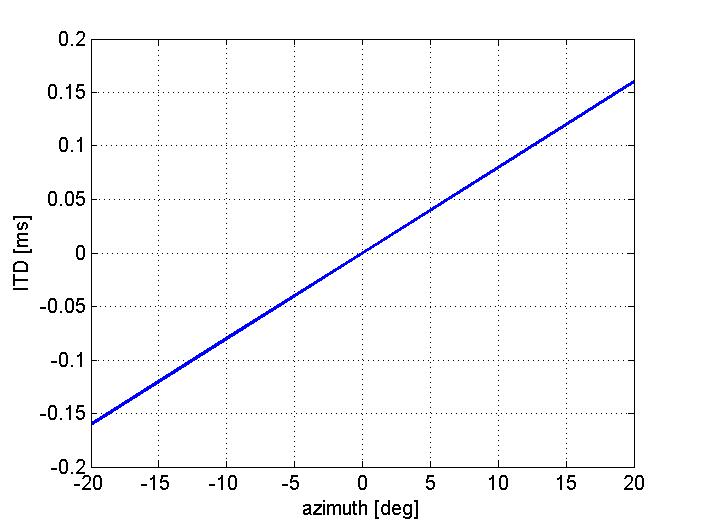
Unlike ILDs, ITDs are generally thought not to vary much with frequency. The graph below shows ITDs as a function of sound source direction measured in an adult male with small microphones inserted in the ear canal.
Question: Use the graph to work out what MAAs the ITD thresholds you have obtained would correspond to. How do these MAAs compare to those you obtained for ILDs?

